Applications

Thanks to its innovative technology and unique features, major companies in the electronics and semiconductor industries have chosen the TDM system for both quality control and R&D purposes. Our customers appreciate the technical advantages of the TDM system, including its high-resolution sensor, system versatility, and user-friendly interface.

The TDM system is a versatile instrument suited for a wide array of applications, including:

  • Product & Process Development

  • Failure Analysis

  • Reliability Testing

  • Quality Control

Whether you are enhancing your production processes or conducting in-depth research, the TDM system provides the precision and flexibility needed to achieve your goals.

Applications

Component Reflow

BGA Apps Briefing

Thermal profile graph showing a temperature range from 25°C to 260°C, with a 3D thermal surface plot and a 2D color map. The slide is titled 'TDM by INSIDIX BGA 21 Units Application.'

PCB

PCP Apps briefing

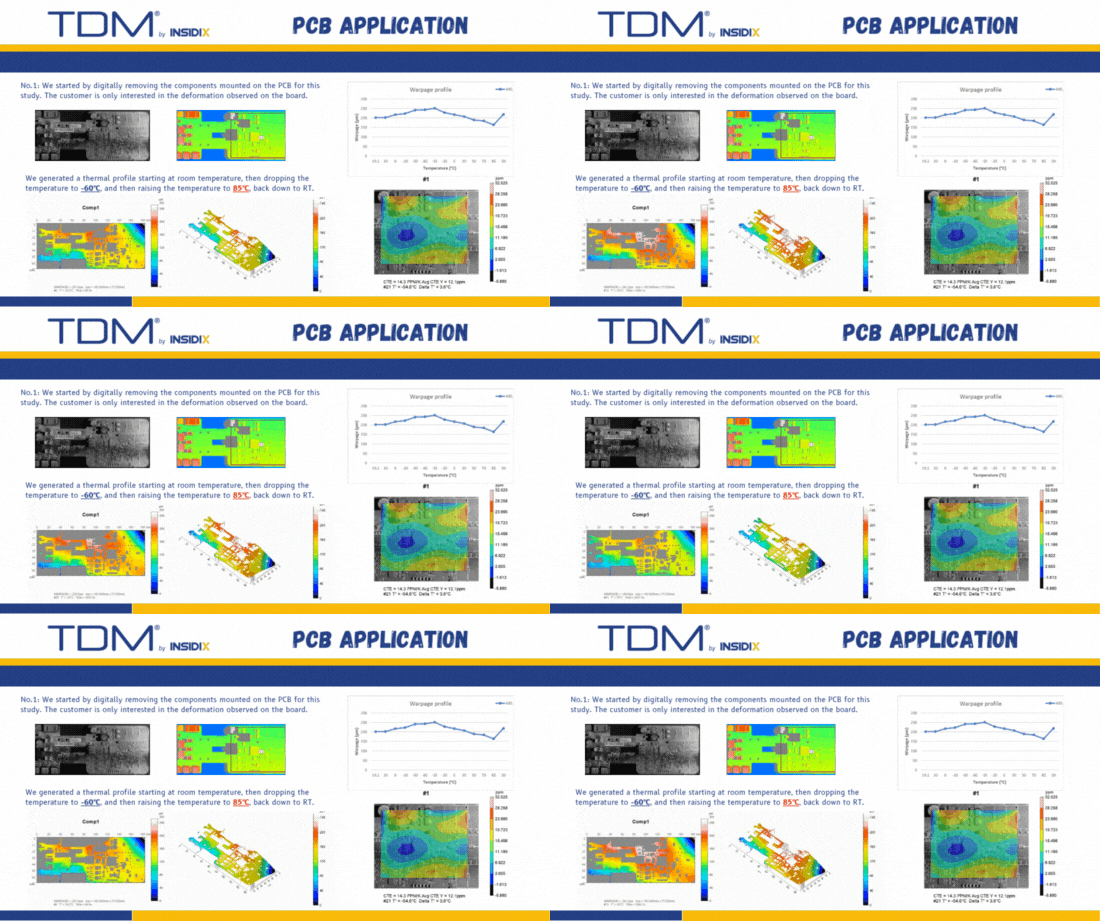
Presentation slide titled 'PCB Application' by TDM INSIDIX, with graphs and thermal profiles showing a diagram of a PCB diagnostic process.

Solder Ball

BGA Apps Briefing

Image of a solder ball application analysis showing a 2D plot with color-coded data, a grayscale image of a circuit board, and a warpage graph on a TDM INSIDIX Solder Ball Application poster.

Sockets

CPU Socket Briefing

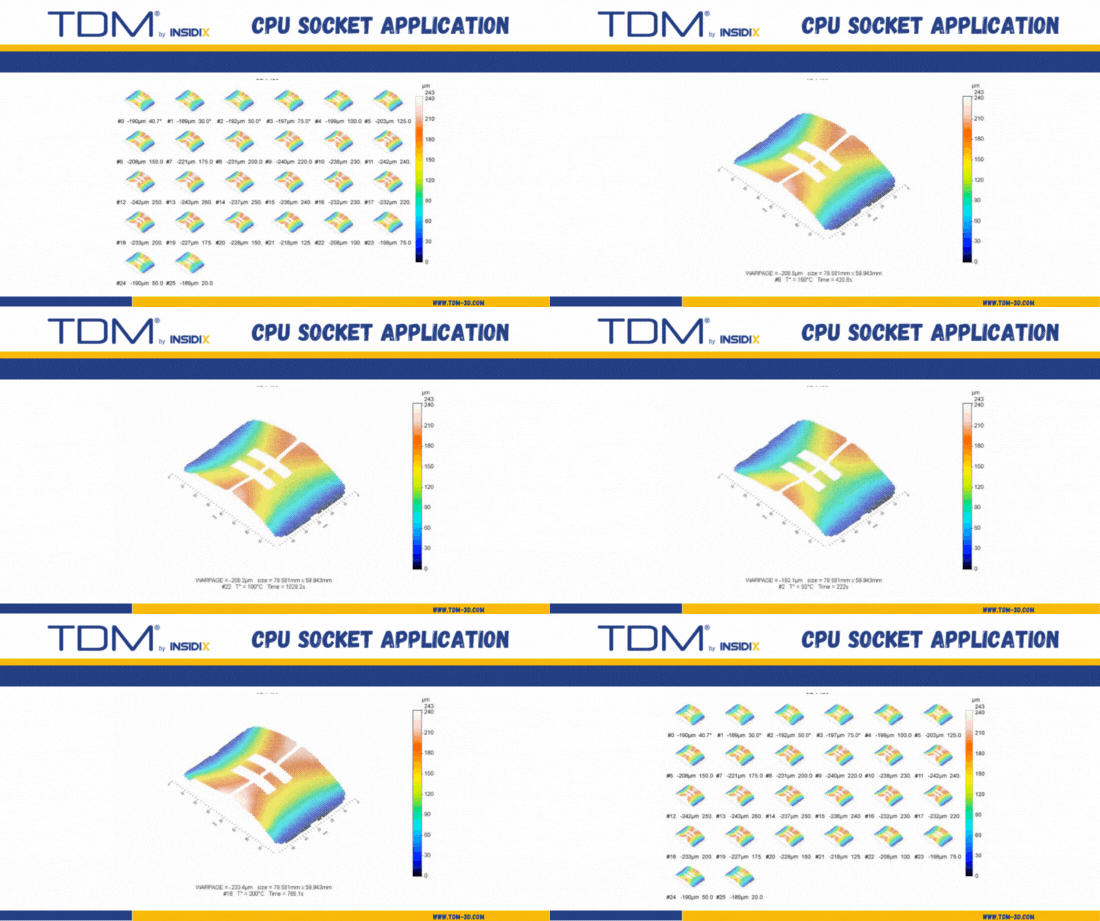
Diagram showing CPU socket application heat maps with labeled sections and a color scale from 75.0 to 243.

Connector

Connector Connector Apps Briefing

Technical data visualization from an application by TDM INSIDIX showing a 2D plot, 3D plot, and a graph of signed warpage results.

Wafer

Wafer Apps Briefing

Diagram showing thermal profile of wafer application with a color scale and a graph of temperature over time.

Power Module

BGA Apps Briefing

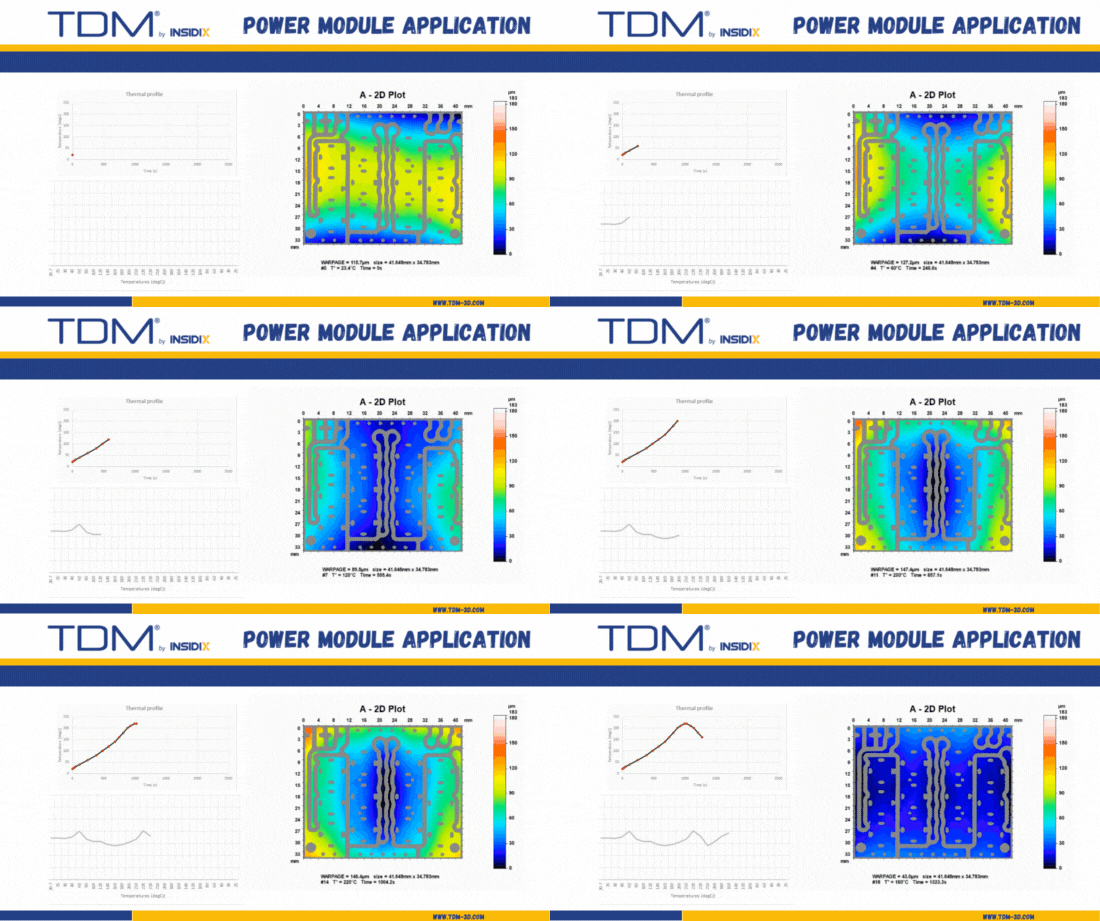
Thermal analysis and 2D plot of a power module application, showing temperature distribution with color gradients.

PANEL

Panel Apps Briefing

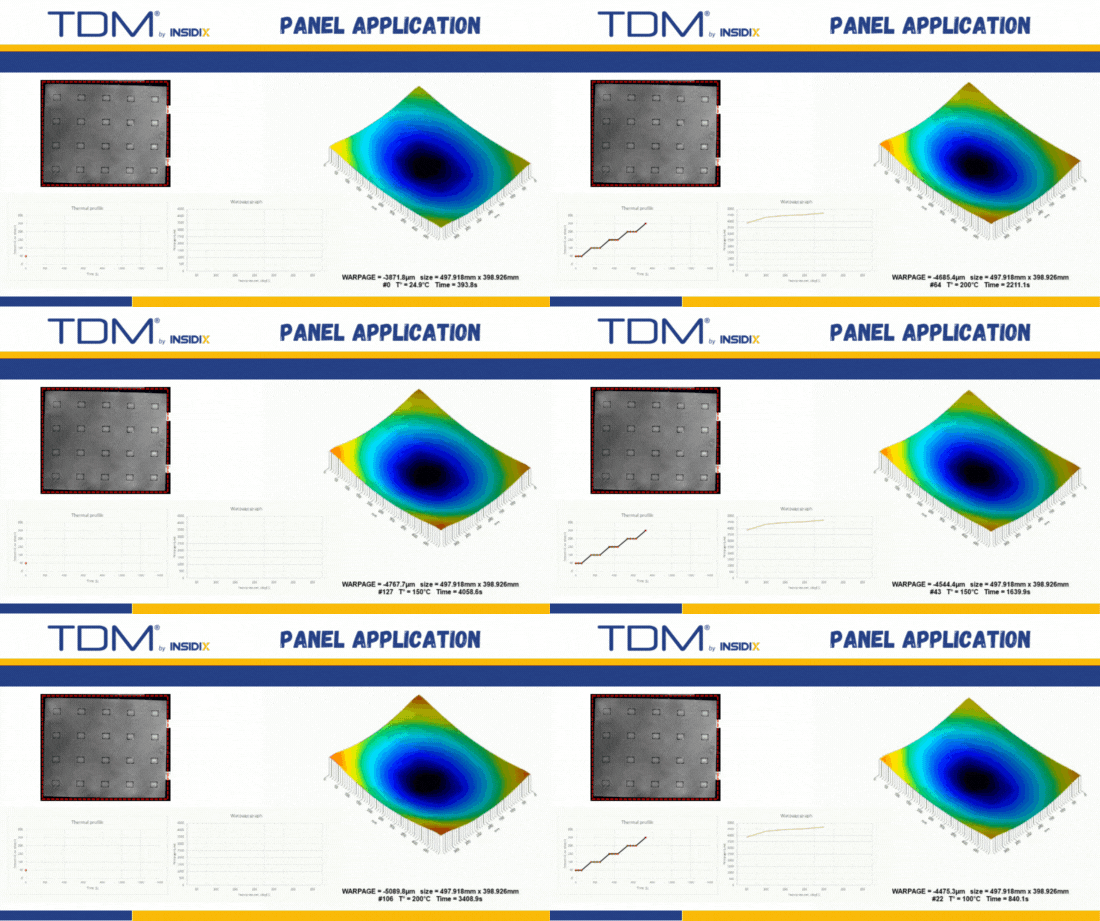
A technical panel application diagram showing a panel with data on thermal profile and wire mass, including a 3D color-coded surface plot representing temperature distribution.

PANEL LEVEL PACKAGE

PLP Apps Briefing

Graph showing thermal profile and 3D surface plot, with a table comparing temperature and color-coded data, and branding for TDM INSDX with panel level package information.

STRIPS

CSP Apps Briefing

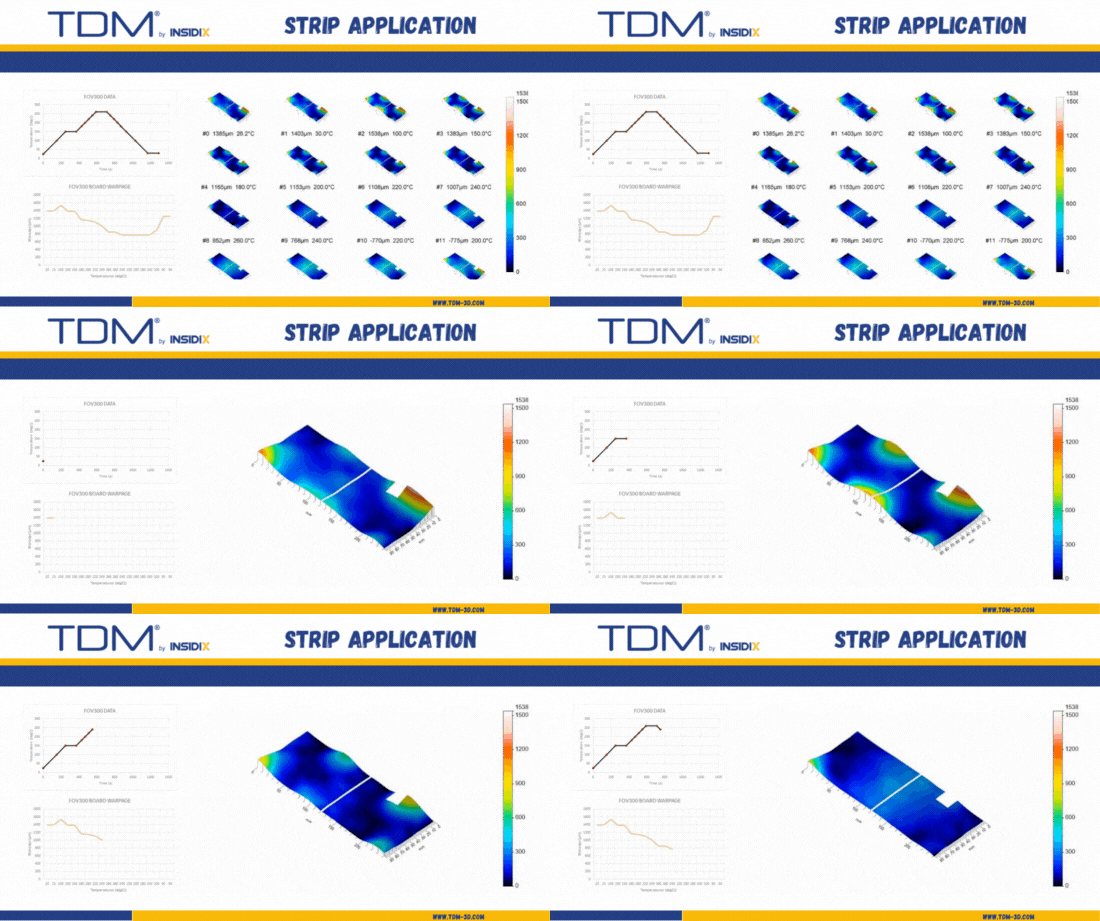
Diagram showing strip application heat maps and graphs related to temperature variations on a TDM INSIDIX equipment.

MULTI-SCALE

Multi Scale Apps Briefing

Slide showing three images of a microchip, each with different resolution and color overlays, illustrating TDM multi-scale application.

CTE + STRAIN

CTE Strain Apps Briefing

A scientific poster with the title "TDM by INSIDIX CTE + STRAIN MEASUREMENTS" displaying graphs and images related to strain data, average displacement, and heat maps, with measurement units in parts per million (ppm), including a color scale, and footer with website URL.

SUBROOM

Neg Temp Apps Briefing

Subroom application thermal analysis chart showing a compact device with a thermal profile graph and a 3D color-coded warp map.