
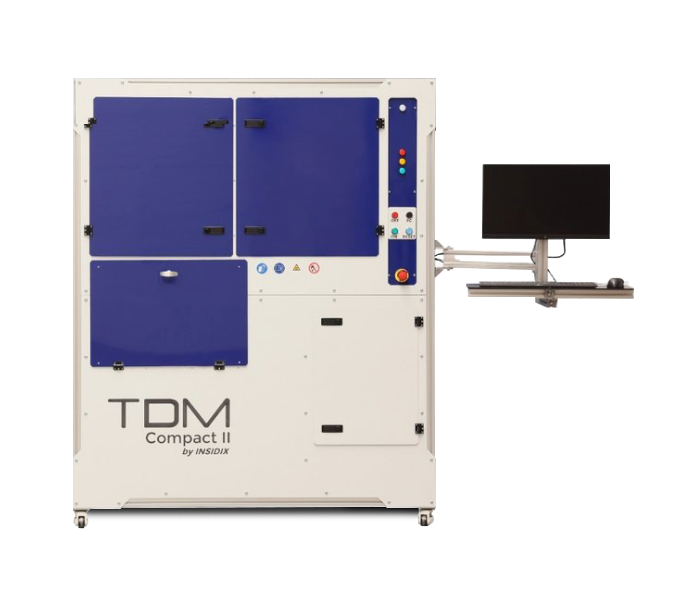
COMPACT-3
Measurement Technology
Out of plane topography analysis by phase shift projection moiré
Camera Resolution
12 MPixels
Minimum & Maximum Sample Size
0.5 x 0.5 mm → 400 x 700 mm
Minimum & Maximum Temperature
Minimum Cooling Rate & Maximum Heating Rate
-65°C → 400°C
up to -3°C/s (sample dependent) & up to +6°C/s (sample dependent)
Homogeneity
>5°C over Ø300 mm area (T<250°C)
Available Modules
CTE + Strain | SubRoom | Scanning + Multi-Scale | TDM-OCT
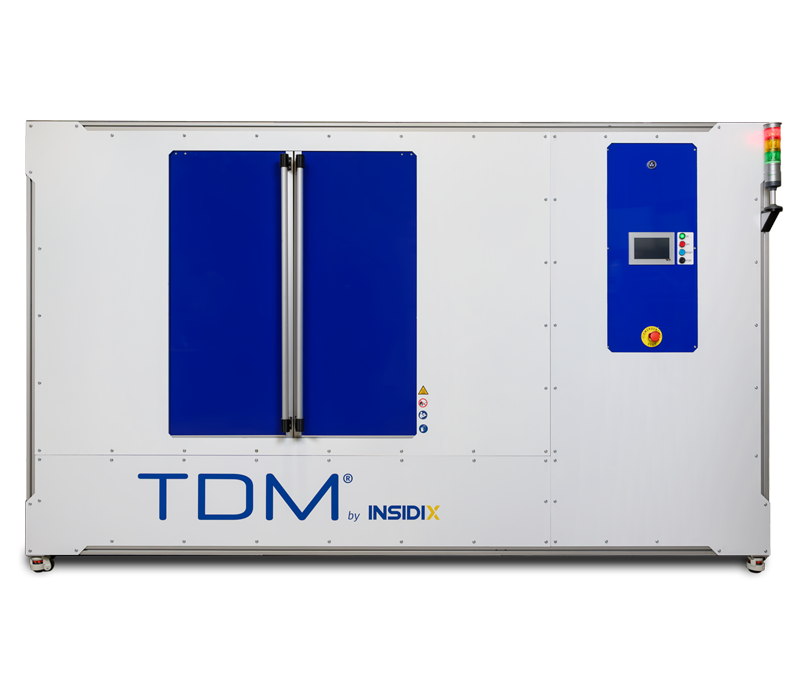
COMPACT-3 XL
Out of plane topography analysis by phase shift projection moiré
Measurement Technology
12 MPixels
Camera Resolution
Minimum & Maximum Sample Size
2 x 2 mm → 800 x 600 mm
Minimum & Maximum Temperature
Minimum Cooling Rate & Maximum Heating Rate
-65°C → 300°C
up to -0.5°C/s (sample dependent) & up to +1°C/s (sample dependent)
Data Acquisition
1 Second
Homogeneity
±7°C over 600 x 600 mm area (T<250°C ±6°C/S)
Available Modules
CTE + Strain | SubRoom | Scanning + Multi-Scale
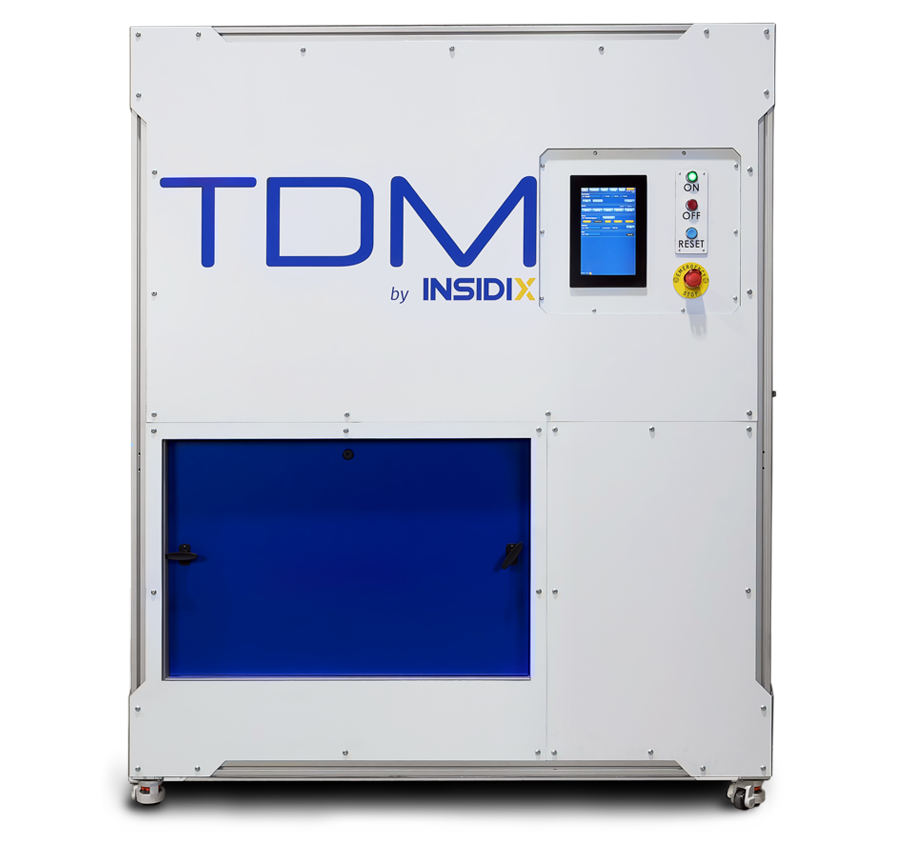
CPT-2
Out of plane topography analysis by phase shift projection moiré
Measurement Technology
Out of plane topography analysis by phase shift projection moiré
12 MPixels
Camera Resolution
Minimum & Maximum Sample Size
0.5 x 0.5 mm → 300 x 300 mm
Minimum & Maximum Temperature
Minimum Cooling Rate & Maximum Heating Rate
-65°C → 300°C
up to -3°C/s (sample dependent) & up to +3°C/s (sample dependent)
1 Second
Data Acquisition
Homogeneity
+/-5°C for 150x150 mm
Available Modules
CTE + Strain | SubRoom
TableTop
Measurement Technology
Out of plane topography analysis by phase shift projection moiré
Camera Resolution
12 MPixels
Minimum & Maximum Sample Size
3 x 3 mm → 200 x 200 mm
Minimum & Maximum Temperature
Minimum Cooling Rate & Maximum Heating Rate
-65°C → 400°C
up to -3°C/s (sample dependent) & up to +3°C/s (sample dependent)
Homogeneity
+/-3°C for 70x70 mm area
Available Modules
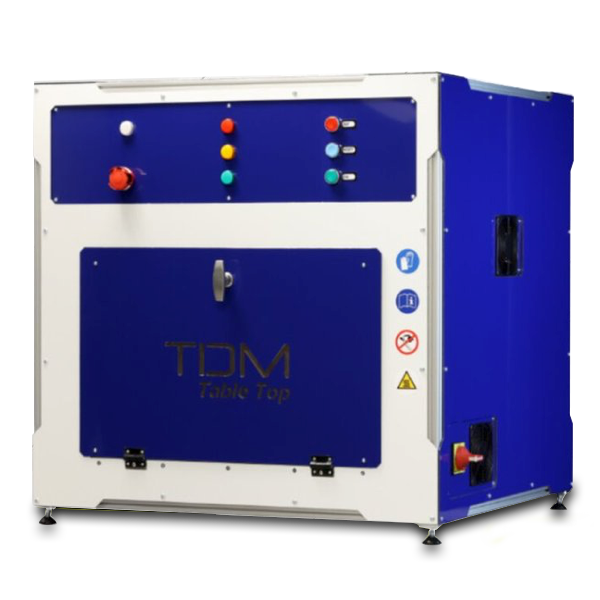
CTE + Strain | SubRoom
TDM-OCT

Optical Coherent Tomography Interferometry based system
Exceptional Precision:
TDM OCT achieves nanometer-scale resolution, redefining precision.
Versatile Analysis:
It conquers challenging surfaces, including transparent and glossy materials.
Complements Fringe Projection:
Expanding our horizons, TDM OCT unlocks previously inaccessible surfaces with coaxial precision.
Broad Applications:
From semiconductor quality control to microelectronics, it's transforming deformation measurement.

WARPAGE Software for Surface Topography Analysis
The Warpage software is designed for Research and Development (R&D) applications. It offers powerful tools for analyzing and visualizing surface topographies with precision and ease.
Key Features:
3D Visualization: Gain in-depth insights with advanced 3D visualizations of surface topographies, allowing for comprehensive analysis and understanding of your samples.
Robust Post-Processing Functions: Enhance your data with a wide array of functions for post-processing and visualization, including:
Leveling
Zooming
Filtering
Surface Combining
Profile Extraction
Data Conversion
These features enable precise adjustments and analyses to meet specific R&D needs.
Comprehensive Data Handling:
Large Number of Functions: The software supports a multitude of data manipulation functions, ensuring you can tailor the analysis to your specific requirements.
Better Visualization: Advanced visualization tools help extract meaningful insights from complex datasets, making it easier to understand and communicate findings.
Seamless Compatibility:
The Warpage software is fully compatible with TDM Batch, ensuring a streamlined warpage measurement and analysis workflow.
Use Warpage software to elevate your R&D capabilities with detailed surface topography analysis and visualization.
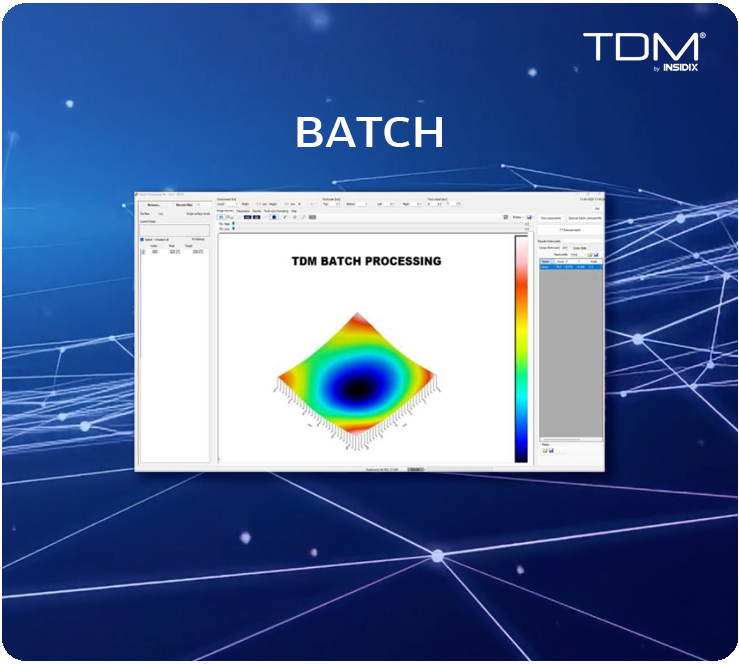
BATCH Software for Warpage Analysis
The BATCH software is designed to streamline the process of warpage analysis with standard routines and automatic reports, ensuring efficiency and precision in every step. It is ideal for handling high volumes of samples and offers a robust solution for process-oriented post-processing tasks.
Key Features:
Standard Post-Processing Routines:
BATCH comes with built-in routines that simplify the warpage analysis process and help achieve consistent results.
Auto Samples Detection & Tracking: Automatically detect and track samples, significantly reducing manual input and potential errors.
Simultaneous Processing: Handle up to 100 samples simultaneously, improving throughput and efficiency.
Advanced Functions:
Perform advanced analysis, such as ball coplanarity and relative warpage, to gain deeper insights into your samples.
Comprehensive Exports: Export statistical data, generate auto reports, and create 3D views of warpage evolution, facilitating thorough analysis and documentation.
Seamless Compatibility:
The BATCH software is fully compatible with TDM Warpage, allowing for an integrated workflow that enhances your Warpage measurement and analysis capabilities.
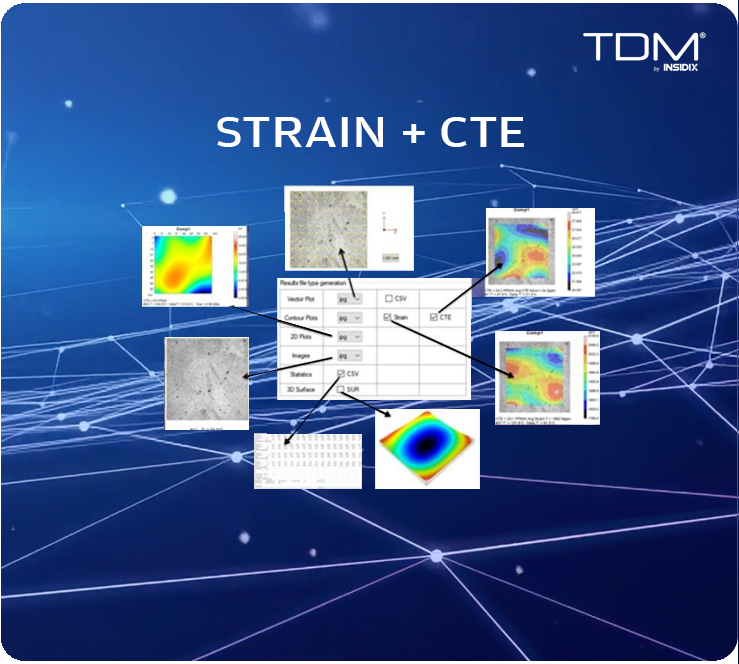
STRAIN Software for Precise Strain Analysis
Advanced Strain Analysis with STRAIN Software
The STRAIN software is designed for process-oriented post-processing, offering robust tools for precise strain analysis and detailed insights.
Key Features:
Standard Post-Processing Routines: Simplifies the analysis process with built-in routines, ensuring consistency and efficiency in strain measurement and evaluation.
Axis-Specific Analysis: Allows for strain separation through the X and Y axes, providing detailed insights into directional strain characteristics.
Comprehensive Exports: This option offers extensive options for exporting strain and coefficient of thermal expansion (CTE) data, facilitating thorough analysis and documentation.
The STRAIN software integrates seamlessly with TDM systems, enhancing your capability to measure and analyze strain precisely.
Leverage the power of STRAIN software to achieve detailed, process-oriented strain analysis and improve the reliability and performance of your materials and products.

STITCHER Software for High-Resolution Warpage Analysis
Comprehensive Warpage Analysis with STITCHER Software
The STITCHER software enhances warpage analysis by merging independently measured data from various locations, resulting in high-resolution, comprehensive images.
Key Features:
Data Merging: Seamlessly merge warpage data measured at different locations to create a unified, detailed analysis.
High-Resolution Imaging: Produce high-resolution images extending beyond a single image's constraints, offering a more complete and accurate visualization.
Enhanced Insights: Combining data from multiple points ensures a thorough understanding of warpage distribution across the entire sample.
The STITCHER software integrates seamlessly with TDM systems, enhancing your capabilities in measuring and analyzing warpages with precision.
Leverage the power of STITCHER software to achieve detailed, high-resolution warpage analysis, ensuring the reliability and performance of your materials and products.
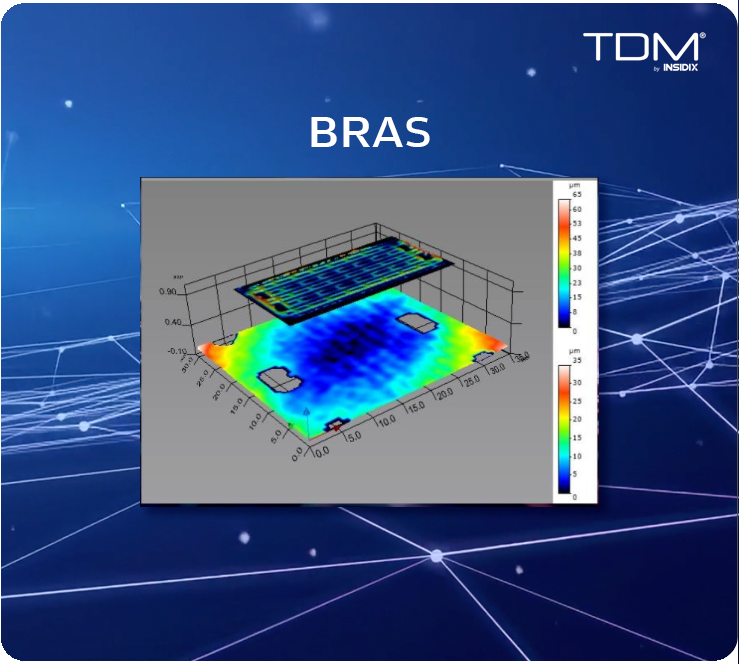
BRAS Software for Comparative Surface Analysis
Advanced Surface Comparison with BRAS Software
The BRAS software is created to offer advanced tools for comparing and stacking series of surfaces, providing detailed insights into surface variations and characteristics.
Key Features:
- Surface Comparison: Easily compare multiple surfaces to identify variations and similarities, enhancing understanding surface properties.
- Stacking Series: Stack series of surfaces to visualize and analyze changes over time or under different conditions.
- Multiple Surface Separation: Effectively separate and analyze multiple surfaces within a single dataset, providing a comprehensive view of surface interactions and properties.
The BRAS software integrates seamlessly with TDM systems, enhancing your capabilities in surface measurement and analysis with precision.

Multi Scale Module
Captures a large initial image with a wide Field of View (FOV) at a lower resolution. This allows for a global overview of the sample's topography and potential deformation areas.
Enables switching the FOV to a smaller area of interest. This is achieved by adjusting the optics of both the fringe projector and the 3D sensor (likely using rotative optics, similar to a microscope objective).
Acquires a higher resolution measurement of the focused area. By narrowing the FOV, the system can capture more detailed information about the warpage or deformation in specific regions.
Facilitates a transition from a "global" image to a "focused" image. This two-step process allows for efficient identification of critical areas and subsequent high-precision analysis.
Optimizes measurement time by first surveying a large area and then focusing on specific regions. This avoids the need to perform high-resolution scans across the entire sample, which would be time-consuming.

Subroom Module
Enables the thermal chamber to reach negative temperatures, down to -65°C. This expands the range of thermal evaluations possible.
Provides cooling performance through a chiller system. This chiller is engaged when the system needs to reach temperatures below ambient.
Exhibits high inertia. This likely means the temperature changes within the subroom are gradual and stable, which can be important for controlled thermal testing.
Offers high homogeneity on complex surfaces. This suggests that the temperature within the subroom is evenly distributed, ensuring consistent thermal conditions across the sample being measured.